ABC Analysis Report
ABC Analysis Report
The report consists of 2 elements - the first element is the bar chart on top of the table. The second element is the table with some of the key KPI's used in the ABC analysis.
ABC Bar Chart
the ABC share shows the total amount of products that are represented in each grade:

In this store, Grade A products have a total retail stock value of 236.301 kr, B graded products have a total stock value of 38.208 kr and C graded products 14.937 kr.
When you hover the bar, you can also see how many products build up the grade - in the example above, Grade C consist of 5 products.
ABC Analysis Table
The main table contains a number of KPI's we look at when grading the product. In this chapter we will explain the various KPI's used in the ABC analyses.
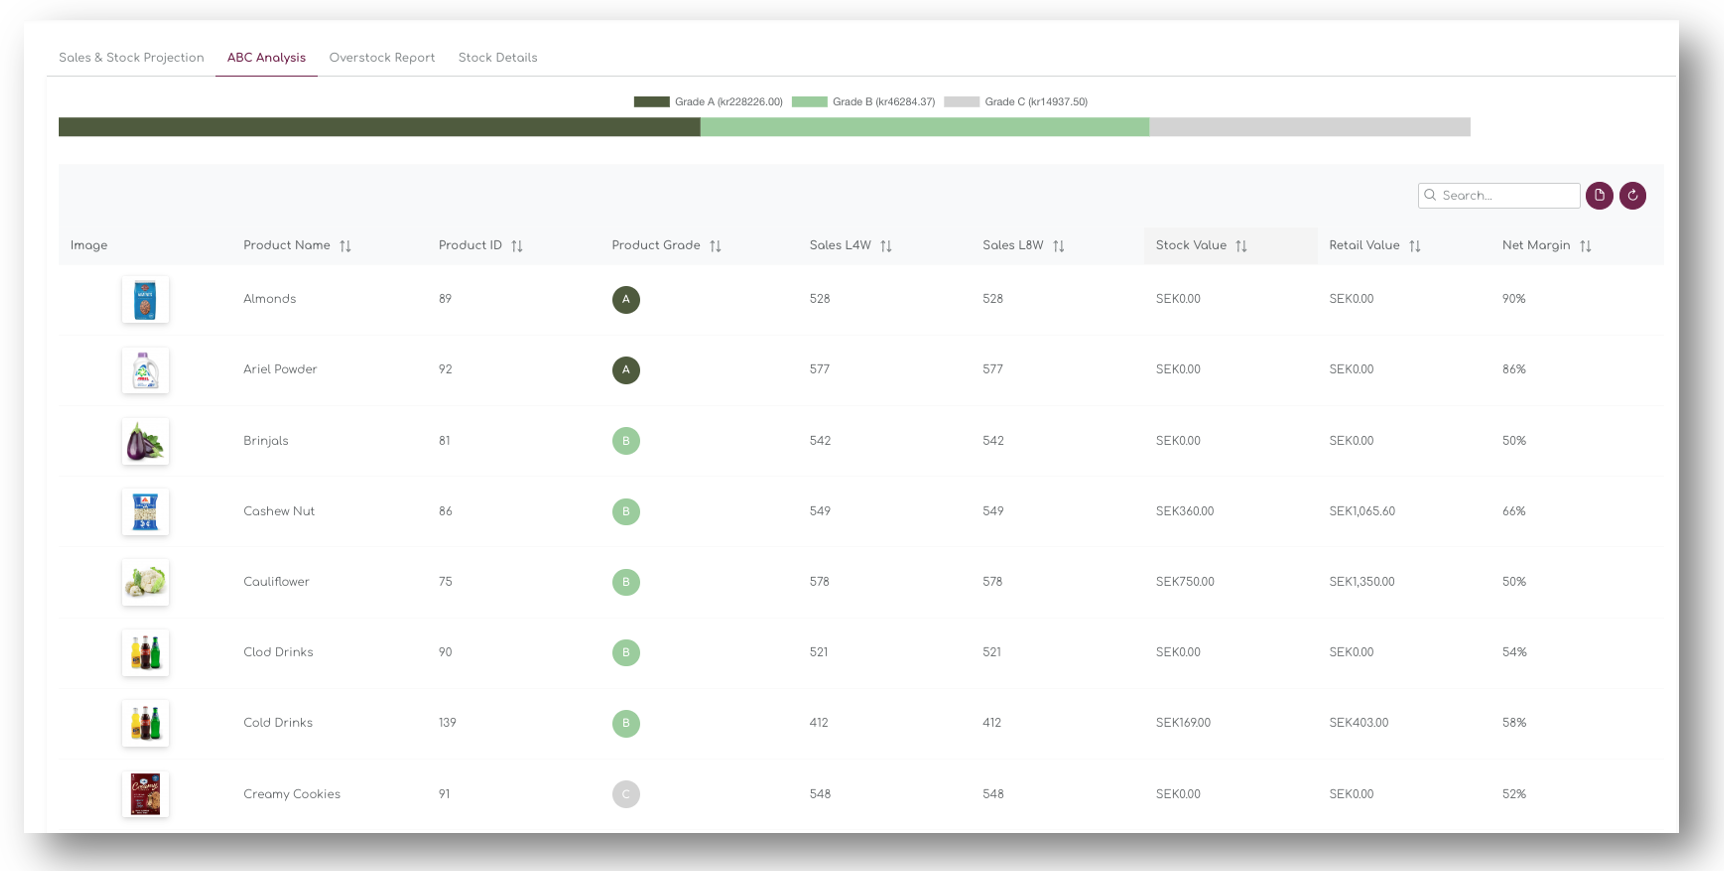
Sales L4W
The analysis is performed on the last 4 weeks of sales (Sales L4W).
Sales L8W
For reference, we also show the last 8 weeks of sales which allows you to determine if the product is trending up or down.
Stock Value
The Stock Value represents the Stock Value at Cost Price.
Retail Value
The Retail Value represents the total value of the the product at sales price, or retail price. In the example below, the first Grade A Product - Almonds' are the best selling product during the last 4 weeks, but the stock value and Retail value are '0.00' becasue the product has ran out of stock.
Net Margin
The Net Margin is the achieved net margin for this product during the past 4 weeks.
ABC Analysis Logic
The Pareto principle, also known as the 80/20 rule, states that 80% of outputs are caused by 20% of the inputs. The principle was discovered by Italian economist Vilfredo Pareto, who observed that 80% of the peas in his garden came from only 20% of the pods he planted. More significantly, he noticed a similar ratio when he realised 80% of land in Italy was owned by 20% of the population. Since then, the Pareto principle has changed how economics is studied and how we understand the distribution of the world’s resources.
The way Pareto’s Principle factors into ABC analysis is how it is used to prioritise and sort specific inventory over others. ABC analysis brings simplicity to inventory analysis by putting all of your stock into three buckets, enabling you to make more strategic decisions.
ABC inventory analysis is based on the Pareto Principle, meaning it’s often the case that about 20% of a company’s inventory accounts for 80% of its value. This insight enables leaders to make more operationally informed decisions.
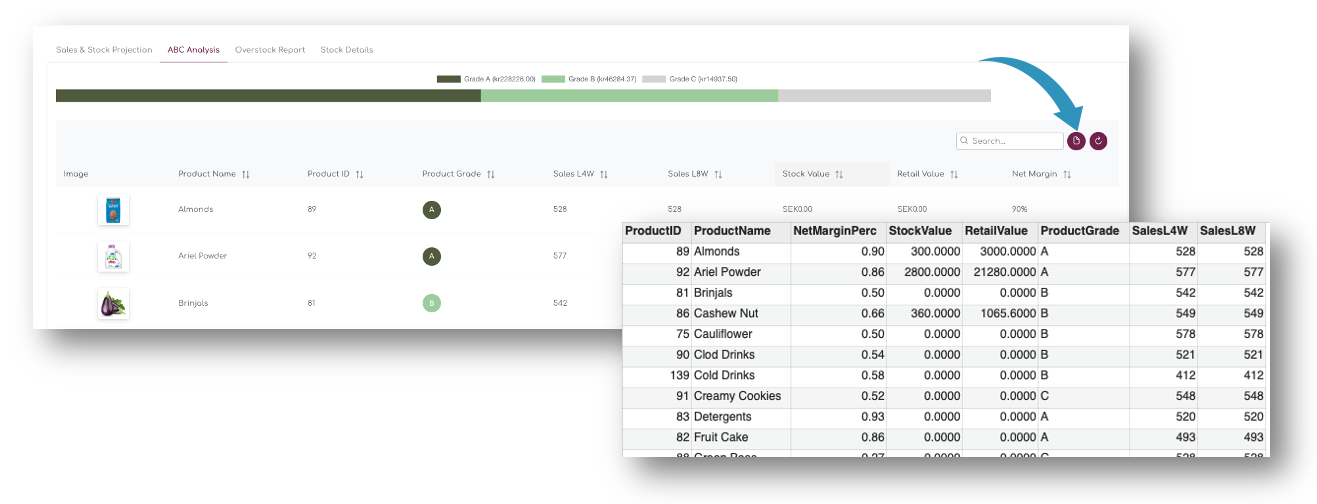
Export ABC Analysis
You can easily export the ABC analysis to a csv file and work on it in Excel or other tools.
Simply use the CSV export button on top of the table and download the file: