Sales & Stock projection
Sales & Stock Projection
In this report, the sales and stock projection for individual products is presented. Start by selecting any of your products in the report:
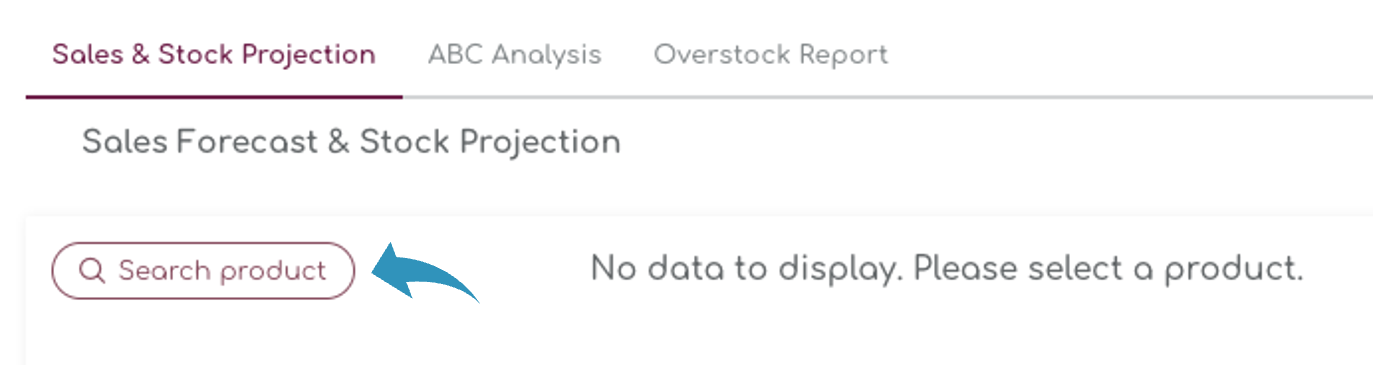
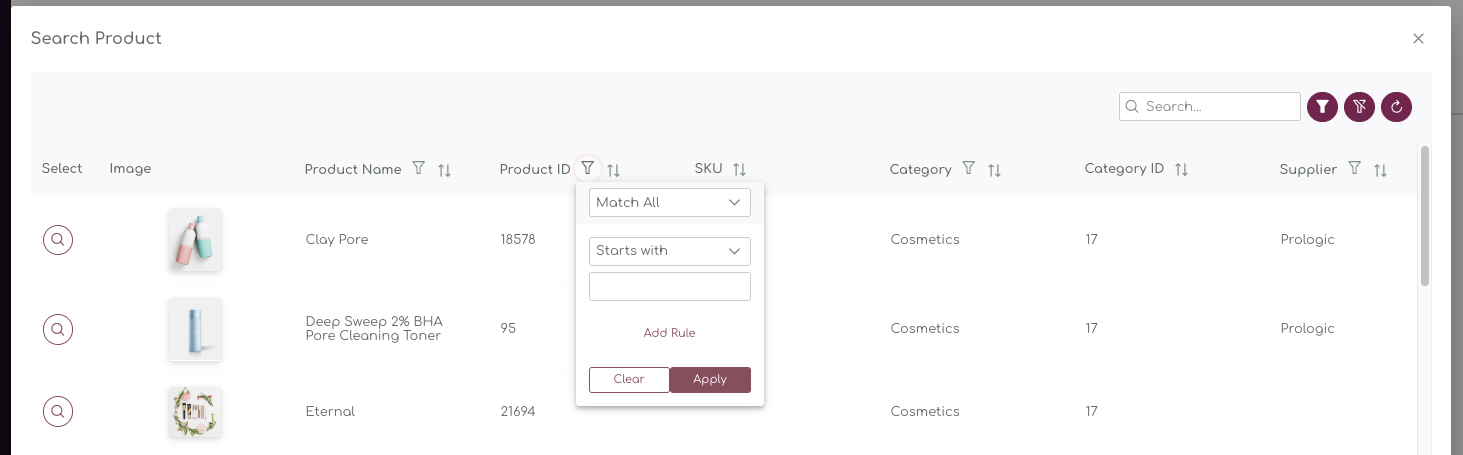
A pop up will appear where you can select any of your products, either by searching them, or using the filter:
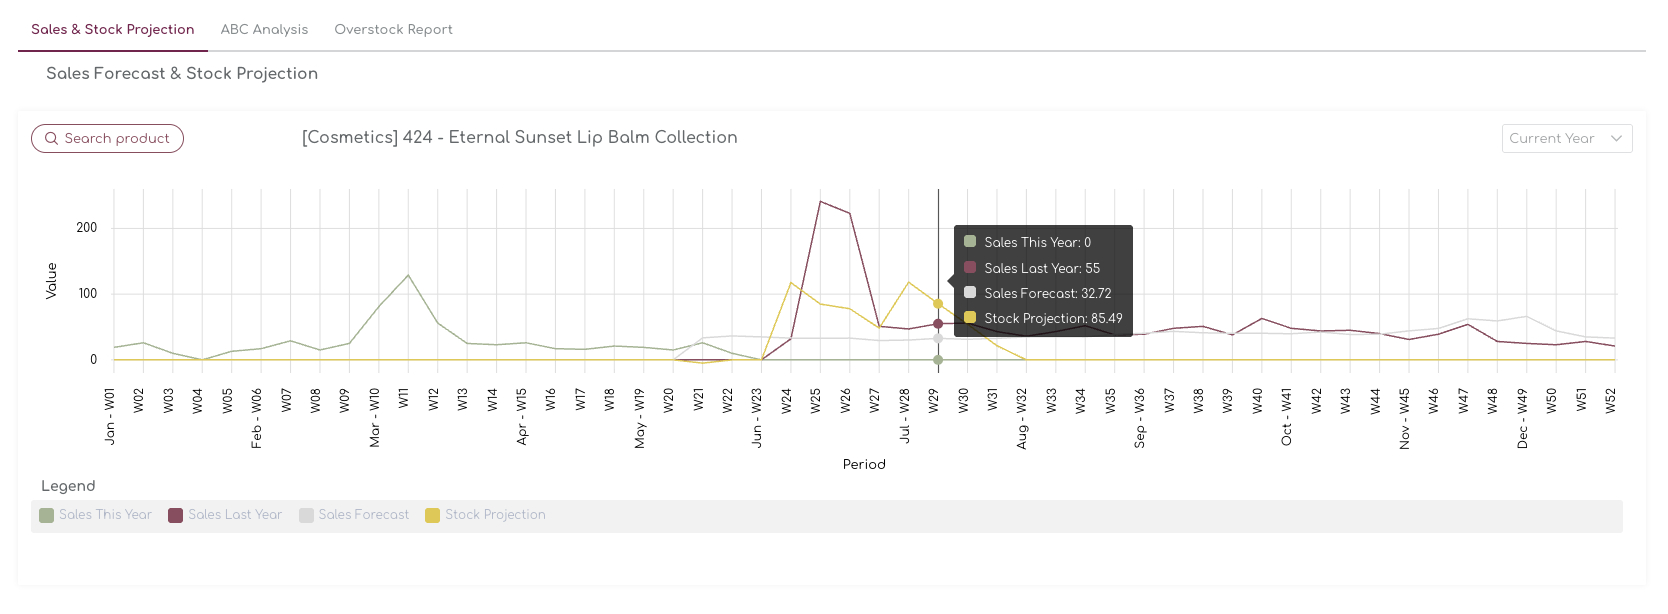
When you have selected a product, the report will populate, showing:
- Sales Year To Date
- Last Year Sales
- Sales Forecast in units for the next 12 months
- Stock projection for the next 12 months
Sales Forecast
Every night, a new sales forecast is generated for your store. The Sales Forecast is presented as the grey line in the graph, shown for the next 26 weeks:
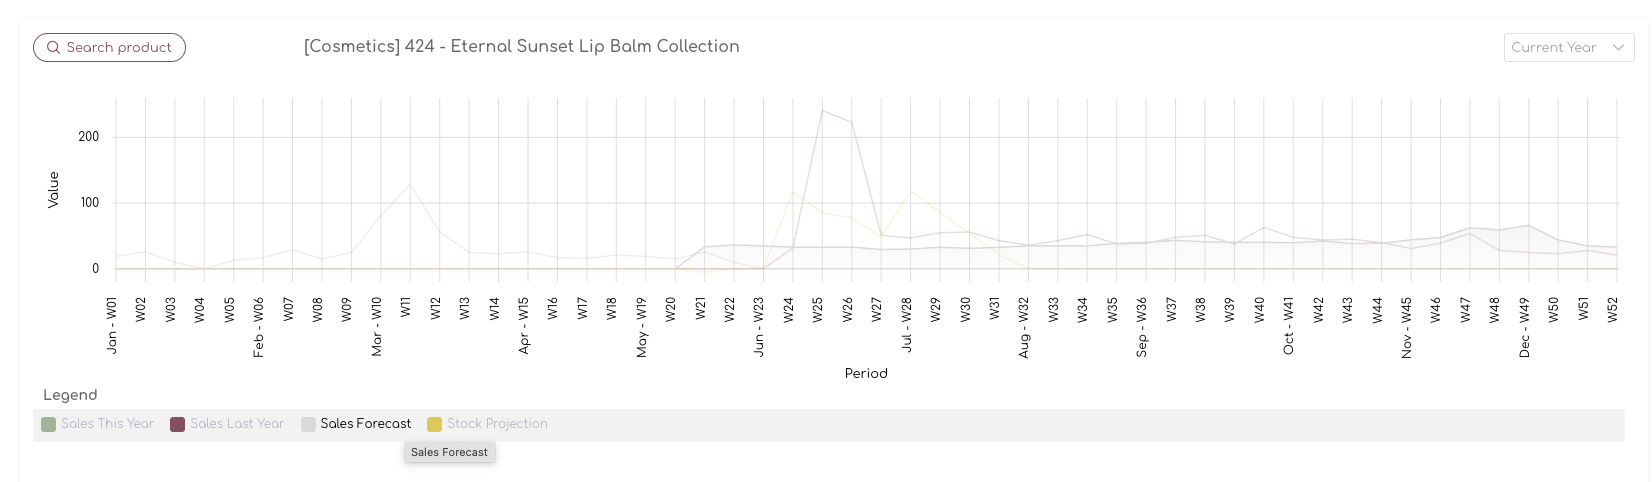
The Sales Forecast takes into account seasonality, past and future events and is also allows us to calculate your Ideal Stock for each SKU.
Sales Year To Date
The green line in the chart shows the Sales Year To Date. It's clear to see this product had a significant bump in sales prior to Mother's Day in March (in the UK):
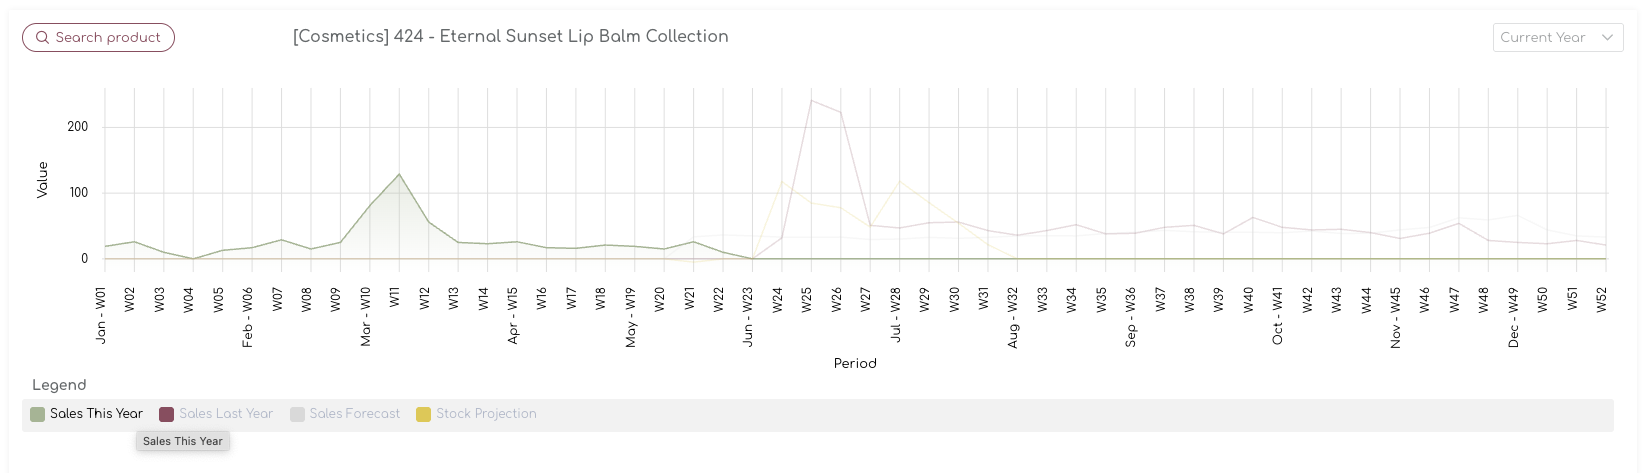
For this particular product, this is seasonal behaviour and will be used to refine the seasonality pattern for next year for similar products.
Sales Last Year
Last Year's Sales takes into account all 'Completed' orders in your store:
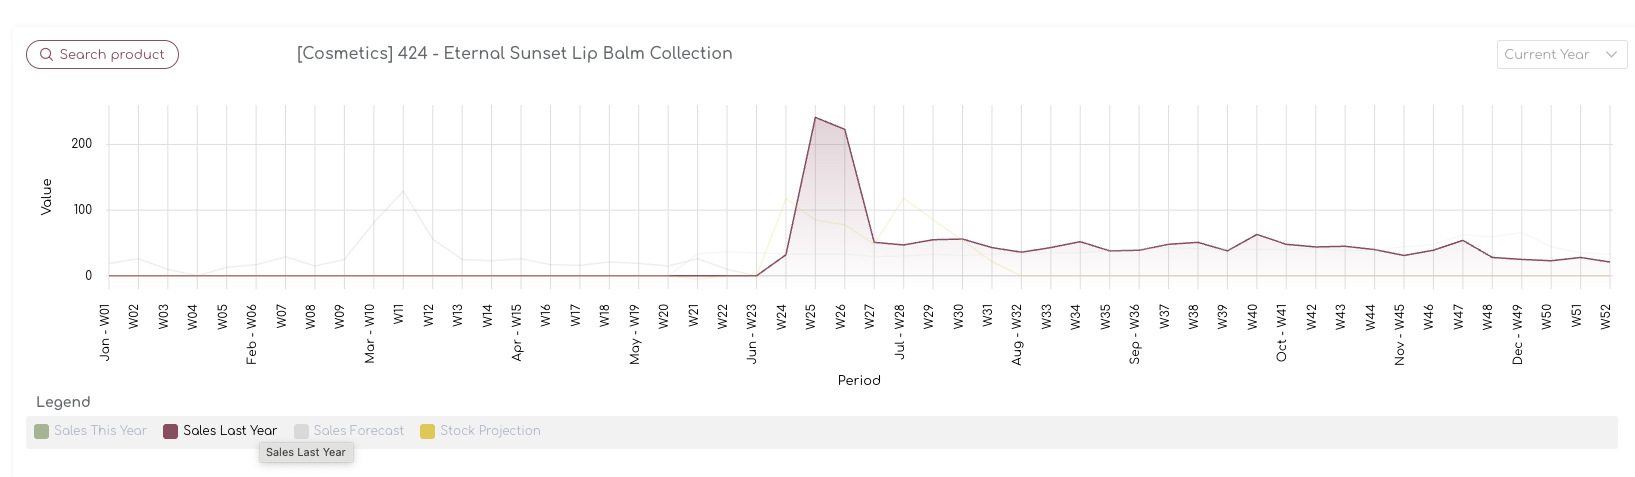
The Last Year Sales is used to understand general seasonality patterns, but we also look at events and campaigns, markdowns that were present in the period to understand whether there were anomalies in the sales, or any outliers.
We also look at a number of trends ad patterns, for example how your 'New Product Introductions' behave compared to more stable products.
Stock Projection
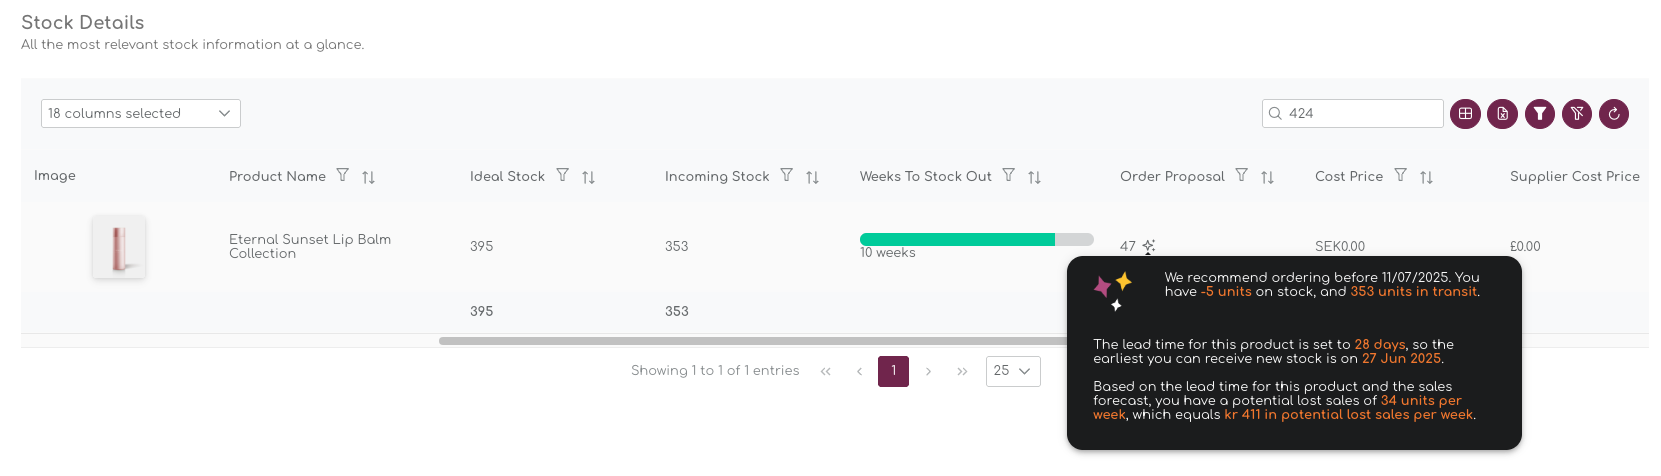
For the Stock Projection, we take all of the above into account - the sales forecast for each SKU, any open or incoming orders and your current stock levels:
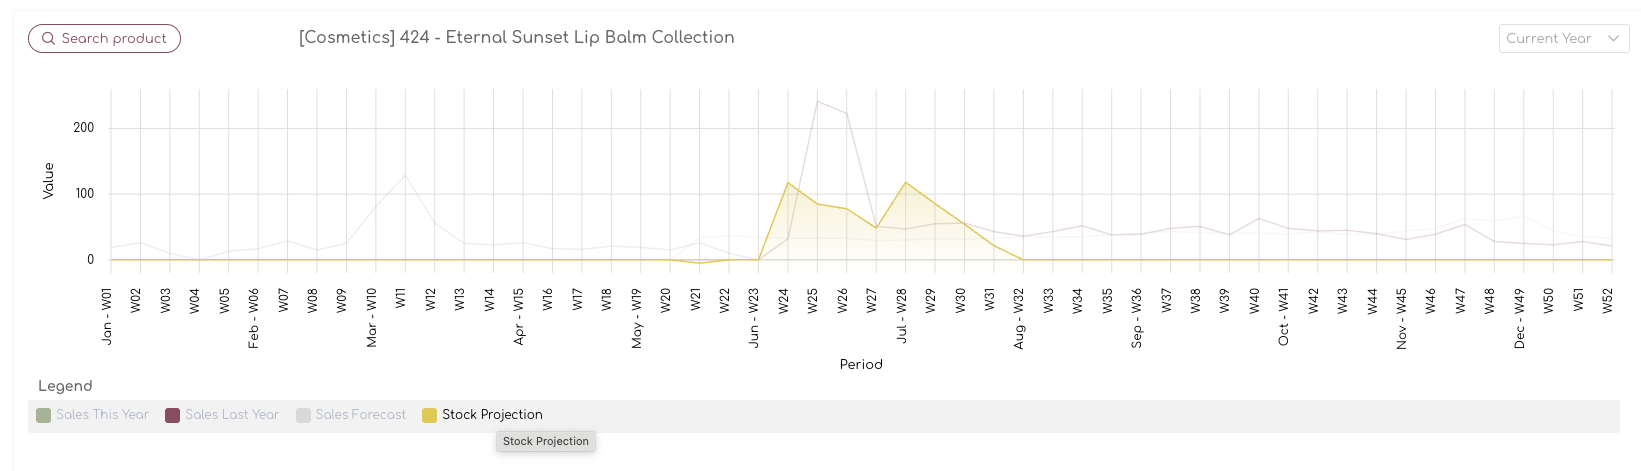
For example, for the product in the image above, new stock is scheduled for receipt in Week 28, raising the stock in the store again and adjusting the Stock Projection.
In this case, the Stock is projected to run out by Week 32 in August, which you will also be notified on in the Order Proposals: