
Weeks of Stock
Weeks of Stock
Weeks of Stock, also known as Weeks of Supply (WoS) or 'Weeks of Cover' (WoC), is a key metric used in inventory management to estimate how long your current inventory will last based on your sales rate. It helps you understand if you have enough stock to meet future demand and avoid stockouts or overstocking.
In Shelf Planner, we use the Weeks of Stock (WoS) parameter to define how much stock you should carry, giving you a strategic way to align your inventory levels with the sales velocity and demand patterns in your store.
How to Use Weeks of Stock in Shelf Planner
There are two ways to define the Weeks of Stock for the products in your store:
- Default Weeks of Stock
- Weeks of Stock by Product (SKU)
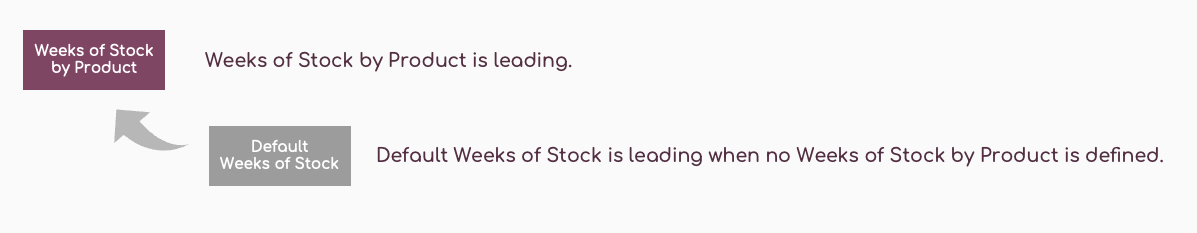
Similar to the Lead Times, we use a so called cascading logic for the Weeks of Stock. This means, that if you don't add a Weeks of Stock Parameter on a product level, the algorithm will use the Default Weeks of Stock instead.
Default Weeks of Stock
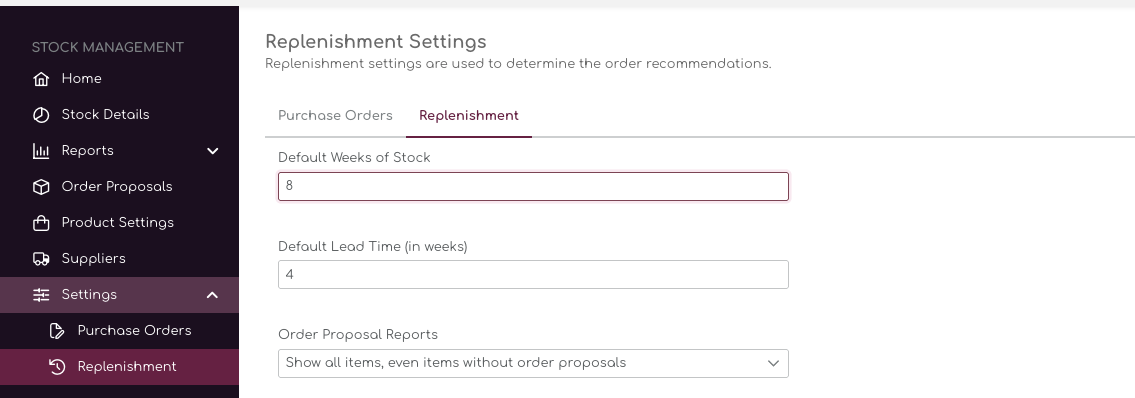
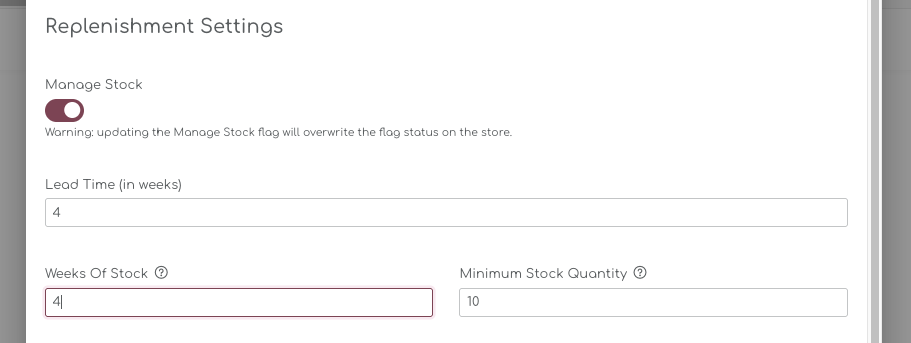
When you start with Shelf Planner for the first time, we use a default Weeks of Stock of 6 weeks. This parameter can be changed under the Replenishment Settings:
The default Weeks of Stock is different for every retailer and will also differ per industry, or even categories within industries. It
Weeks of Stock by Product
For each Product (SKU) you can determine the Weeks of Stock in the Product Settings pages:
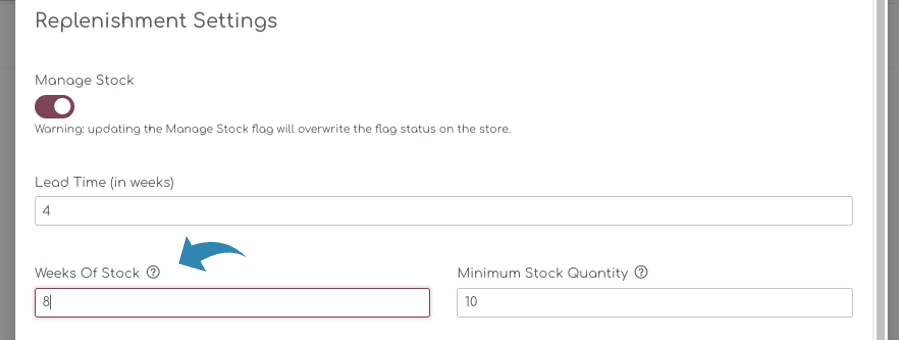
When you start using the app for the first time, this field is empty and for all products the system is using the Default Weeks of Stock. When you enter a new value here, the system will automatically and immediately recalculate your Ideal Stock and the updated Order Proposal.
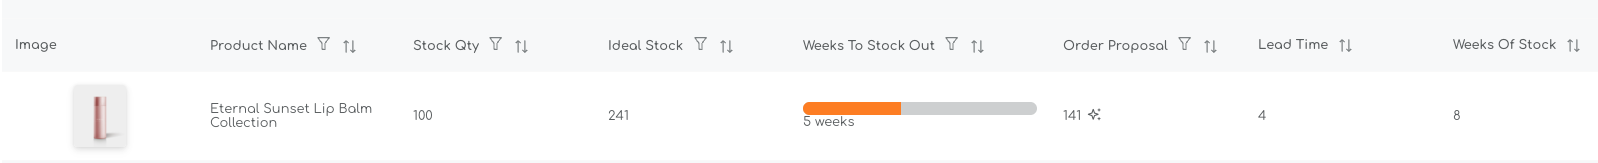
For example, the item below has an Ideal Stock of 241 units. This number if based on the Lead Time of 4 weeks for this products and a Weeks of Stock of 8 weeks. The system also show that this item will run out in 5 weeks and therefor triggers a reorder recommendation.
If we change the Weeks of Stock Parameter to 4 weeks, this should mean the Ideal Stock is reduced.
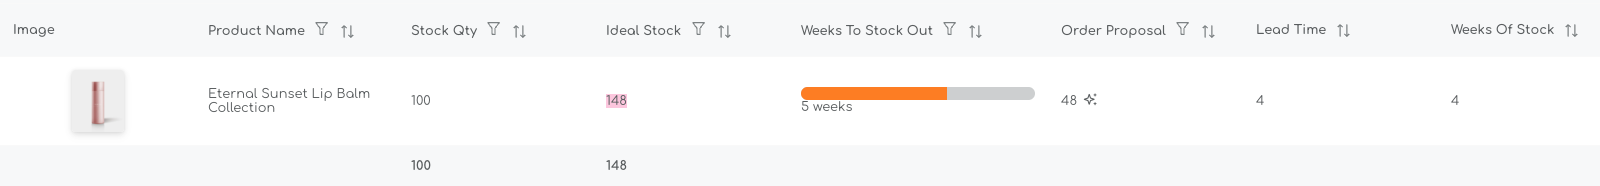
As soon as you save the data, the system will immediately recalculate the new Ideal Stock, which is now based on 4 + 4 weeks of Lead Time and Weeks of Stock.
As a result, the Ideal Stock is now 148 units instead of 241 and the Order Proposal is updated to 48 units instead of 141:
Prioritization Rules
The Weeks of Stock uses a so called 'cascading logic' - when you enter a value for WoS on a product level, this is the leading parameter;
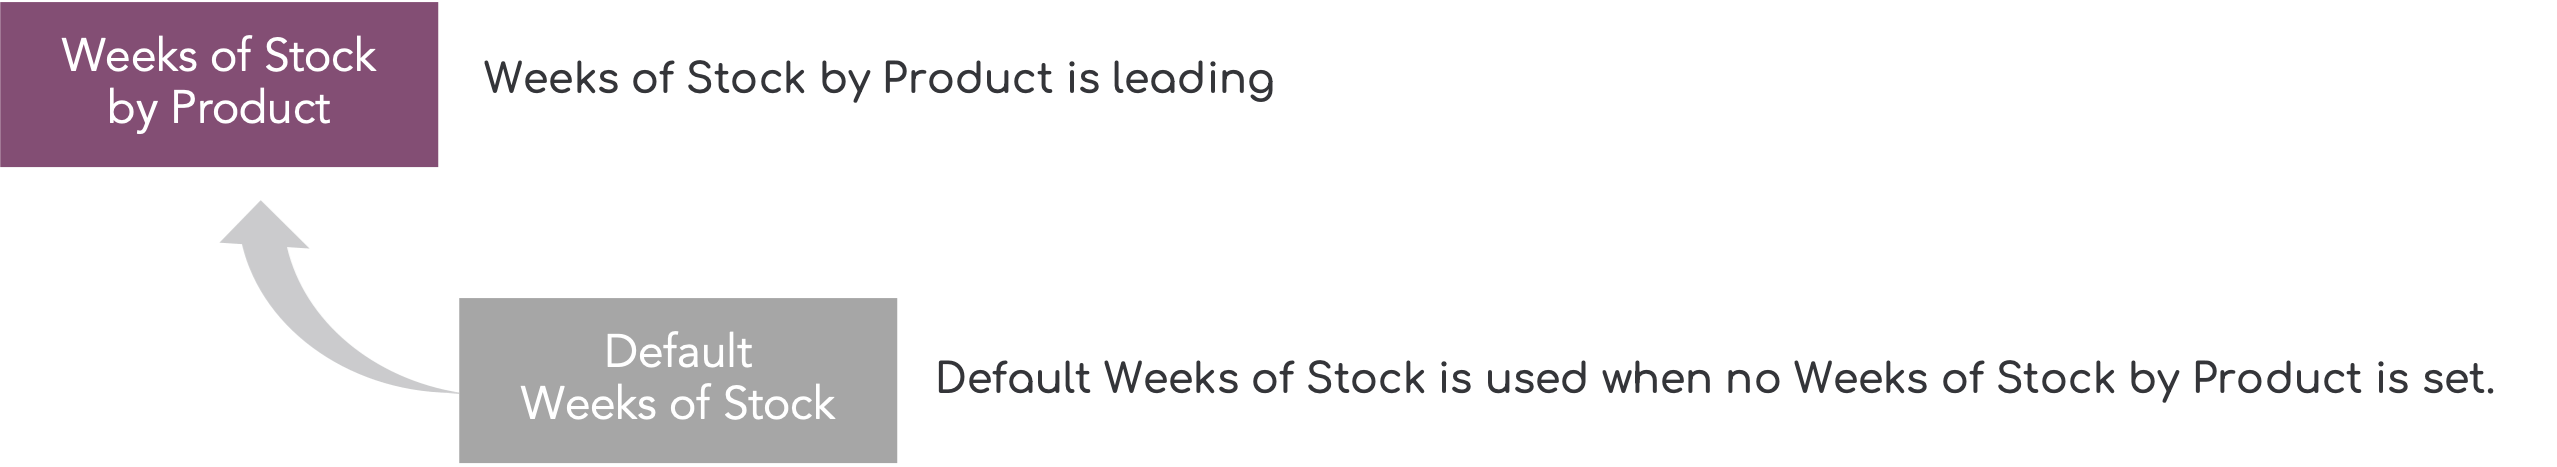
This also means you don't have to enter a WoS for all products. You can simply enter a default for your entire store and change the value for a few selected items.
If no WoS is present for a product, it will automatically use the Default Weeks of Stock.
Guidelines & Recommendations
Your ideal stock levels can vary based on your specific circumstances, such as supplier lead times, customer demand patterns, and storage capacity. Use these recommendations as a foundation, but always be ready to adjust based on what works best for your business. We have summed up the most common categories and provided some guidelines to get this set up for your store.
Everyday Products (like groceries and toiletries):
- Recommendation: Keep 2 to 4 weeks' worth of stock.
- Why? These items sell steadily and don't last forever on the shelf. This amount helps you keep shelves full without overcrowding your storage.
Seasonal or Holiday Items:
- Recommendation: Stock up to 6 to 8 weeks' worth during busy seasons, and drop to 2 to 3 weeks' worth when it's slower.
- Why? You'll need more stock to meet the rush during peak times like holidays. After the season, reduce stock to save on storage and avoid having too much left over.
Perishable Goods (like fresh food or skincare products):
- Recommendation: Keep just 1 to 3 weeks of stock.
- Why? These products can go bad quickly. Keeping less on hand means fresher products for your customers and less waste for you.
Electronics and Appliances:
- Recommendation: Maintain 4 to 6 weeks of stock.
- Why? These items often have longer lead times due to complex supply chains. They also tend to be higher in value, so having a buffer helps manage supplier delays without over-investing in inventory.
Fashion and Apparel:
- Recommendation: Keep 4 to 8 weeks of stock, depending on trends and seasonality.
- Why? Fashion trends can change rapidly, and having a flexible stock level allows you to adapt quickly. Increase stock before the start of a season and reduce it as the season progresses to minimize excess inventory.
| Type of Product | Suggested WoS | Things to Consider |
|---|---|---|
| Every Day Products (FMCG) | 2-4 weeks | Steady sales, limited shelf life |
| Seasonal Items | 6 to 8 week in peak season, 2-3 off season | Sales go up and down, Seasonal Demand |
| Perishable Goods | 1 to 3 weeks | Quick to expire, risk of spoiling |
| Electronics & Appliances | 4 to 6 weeks | Longer Lead Time, higher value |
| Fashion & Apparel | 4 to 8 weeks | Trend-sensitive, seasonal demand |
While these guidelines provide a helpful starting point, remember that every store is unique.
Weeks of Stock, Lead Times and Ideal Stock
Imagine you're planning a road trip. To make sure you have a smooth journey, you need to consider a few key things: how much fuel you'll need, how often you'll stop for refills, and how long it takes to get from one gas station to another. Managing your inventory is quite similar!
Weeks of Stock (WoS):
Think of WoS as the amount of fuel you want to keep in your tank at all times. It's the number of weeks you plan to have enough stock on hand to meet customer demand. If you have 4 weeks of stock, it means you have enough products to last for 4 weeks without needing a refill.
Lead Time:
Lead Time is like the distance between gas stations on your road trip. It's the time it takes from when you place an order with your supplier to when the products arrive at your store. If your supplier takes 2 weeks to deliver new stock, your lead time is 2 weeks.
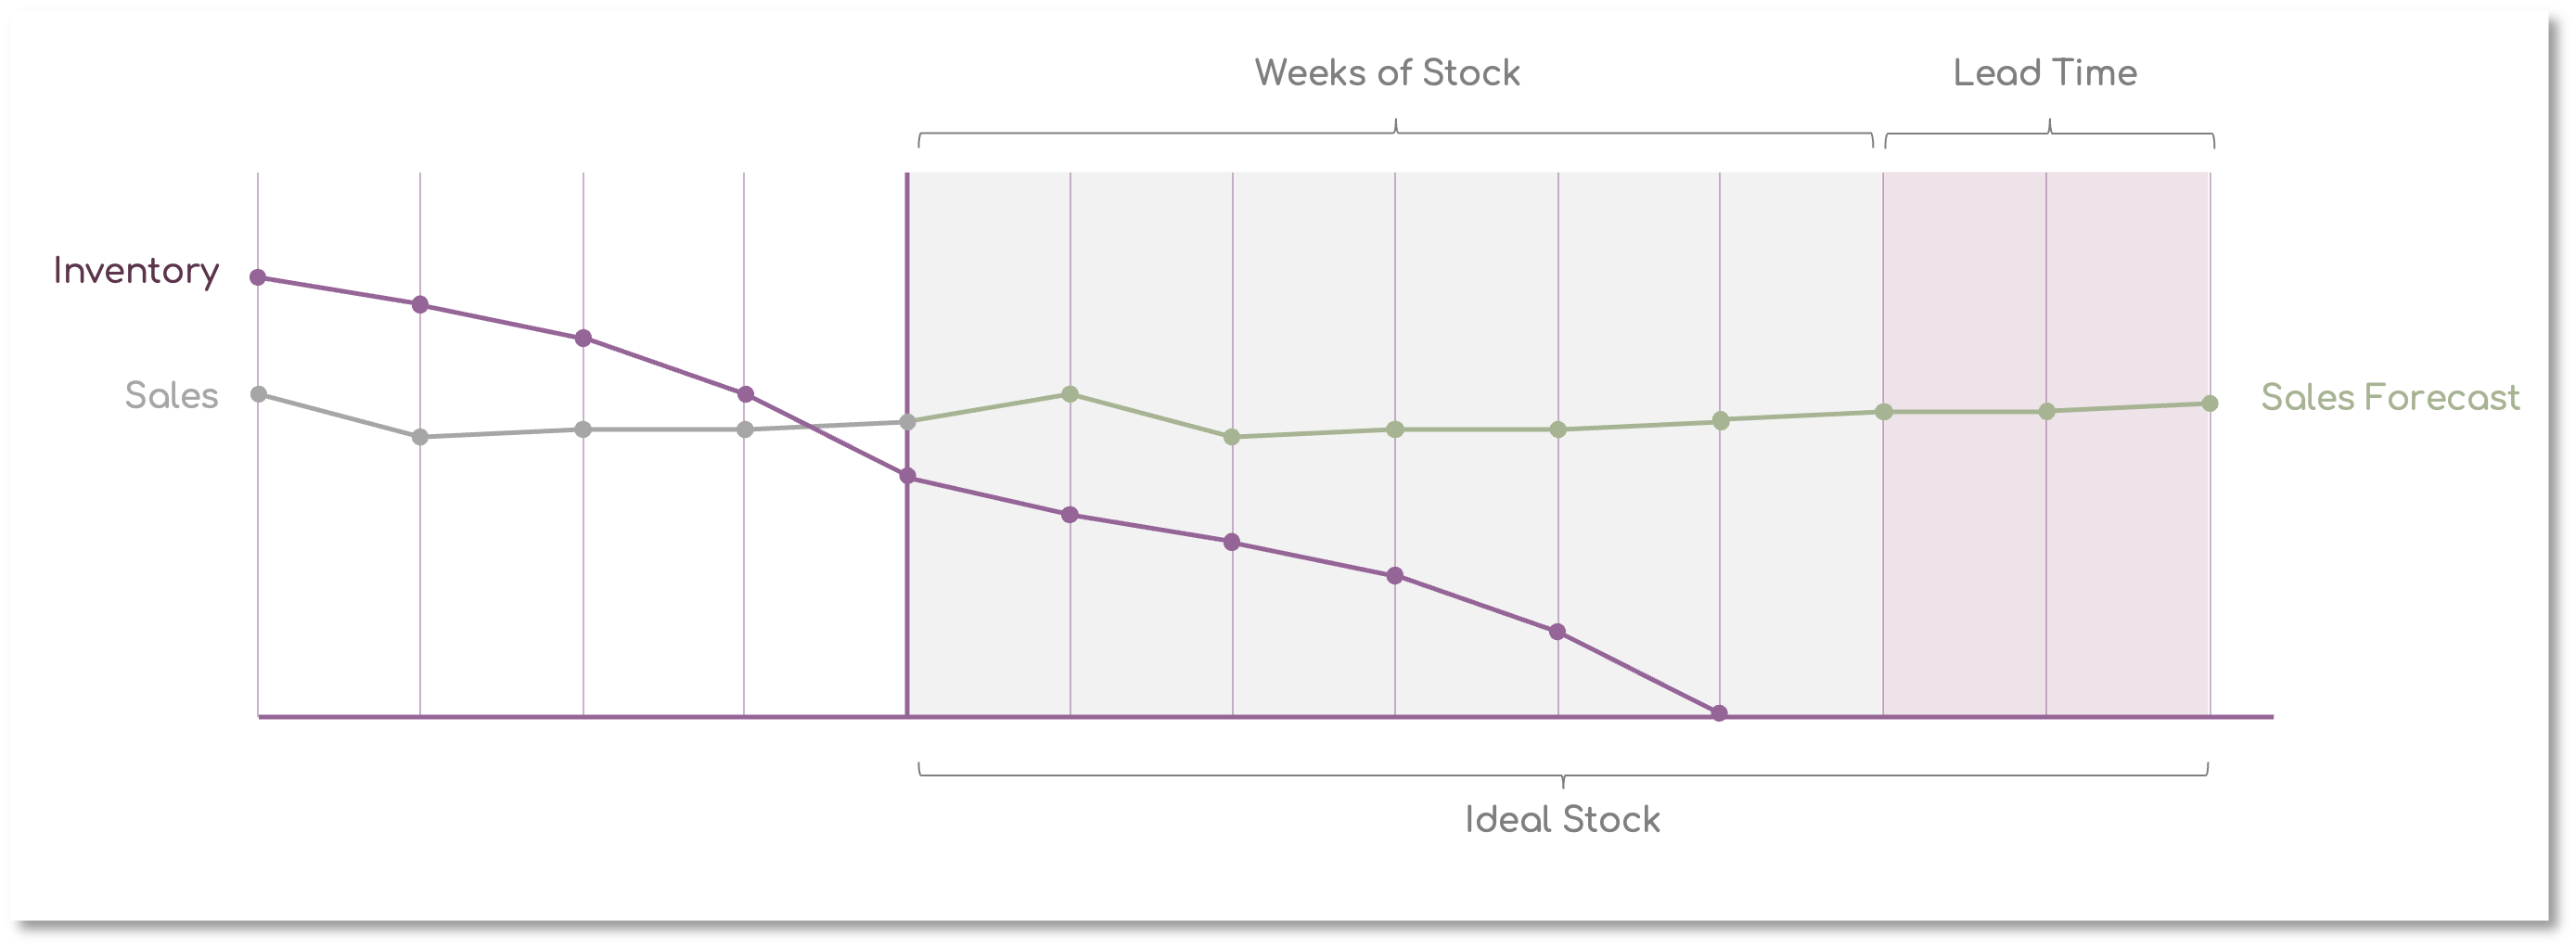
Ideal Stock:
Ideal Stock is the perfect amount of fuel you need to reach the next gas station comfortably without running out. It's the optimal inventory level you should have on hand to meet customer demand, considering both your WoS and Lead Time. To find your Ideal Stock, you need to know how much you sell (your sales forecast) and how long it takes to get new stock.
How they work together
1. Set Your Weeks of Stock
Decide how many weeks of stock you want to keep based on your sales patterns, storage space, and product shelf life. For example, if you sell 100 units per week and want to keep 4 weeks of stock, you aim to have 400 units on hand.
2. Consider Lead Time
If your supplier takes 2 weeks to deliver new stock, you need to place an order before your current stock runs out. In this case, you should place an order when your stock level drops to 200 units (2 weeks of stock) to ensure you have enough time to receive the new stock before you run out.
3. Calculating Ideal Stock
As mentioned before, Shelf Planner automatically calculates your Ideal Stock based on Sales Forecast, Lead Time and Weeks of Stock.
Your Ideal Stock is the sum of the stock you need during the lead time and the stock you want to keep as a buffer (WoS). Using the previous example:
- Sales forecast: 100 units per week
- Lead Time: 2 weeks
- WoS: 4 weeks
- Ideal Stock = (Lead Time * Sales forecast) + (WoS * Sales forecast)
- Ideal Stock = (2 * 100) + (4 * 100) = 200 + 400 = 600 units
By understanding and balancing these three components, you can ensure that your store always has the right amount of stock to meet customer demand without overfilling your storage space.
Benefits
Here’s why it’s valuable:
1. Match Inventory with Sales
Weeks of Stock shows how long your current inventory will last based on your sales forecast. This helps you avoid:
- Overstocking, which ties up cash and increases storage costs.
- Stockouts, which lead to lost sales and customer dissatisfaction.
2. Simplifies Planning
Instead of trying to guess exact order quantities, you can set a target like "I want to keep 4 weeks of stock on hand", and the system calculates what needs to be ordered based on sales trends for each individual item.
3. Adjusts for Seasonality
Weeks of Stock works well with fluctuating demand. During peak seasons, a retailer might increase WoS to prepare for higher sales. In slower periods, they can reduce it to avoid excess.
4. Improves Cash Flow Management
By holding only what’s needed for the defined coverage period, retailers can free up working capital, which is especially important for small businesses.
5. Enables Automation
Tools like Shelf Planner use WoS to automate purchasing decisions. For example, if a product is selling faster than expected and dips below the target weeks of stock, the system will trigger a reorder proposal.