App Landing Page
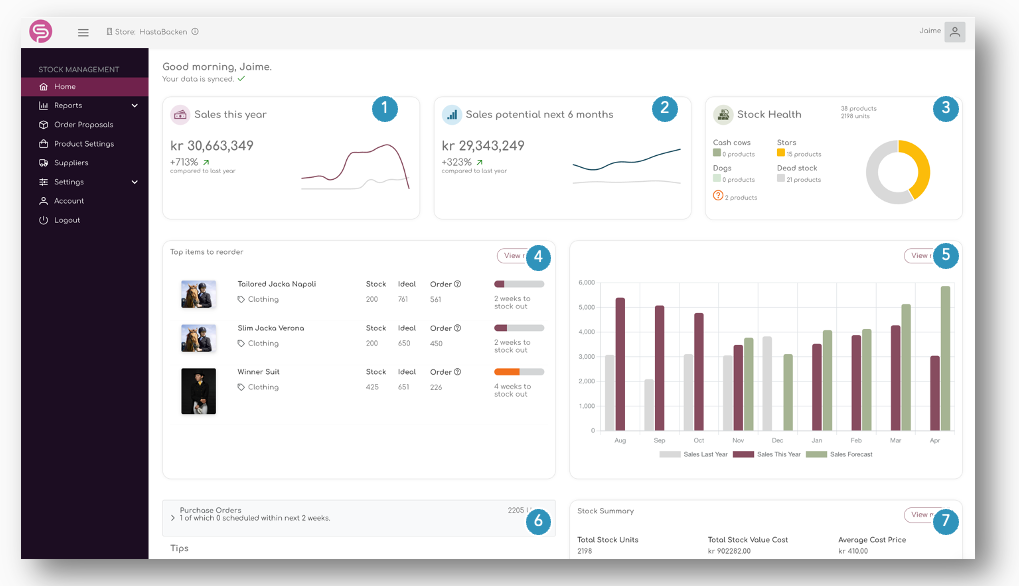
Dashboard
The main landing page in the app shows you your store's performance at a glance and recommendations that might need your attention.
1. Sales Year To Date
On top of the dashboards, three graphs show the performance of your store.
The 'Sales this year' shows the current sales compared to last year in value.
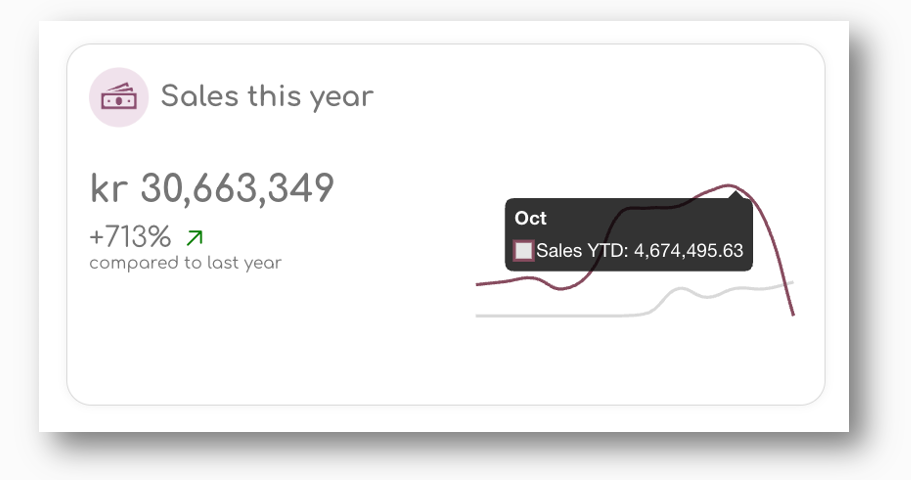
Please note that we only use 'Completed Orders' for this statistic. Orders that are processing or on hold are not included.
By hovering the graph, you can compare this year vs last year sales in value.
2. Sales Potential Next 6 Months
The second graph on top of the page shows the sales potential for your store in the next 6 months:
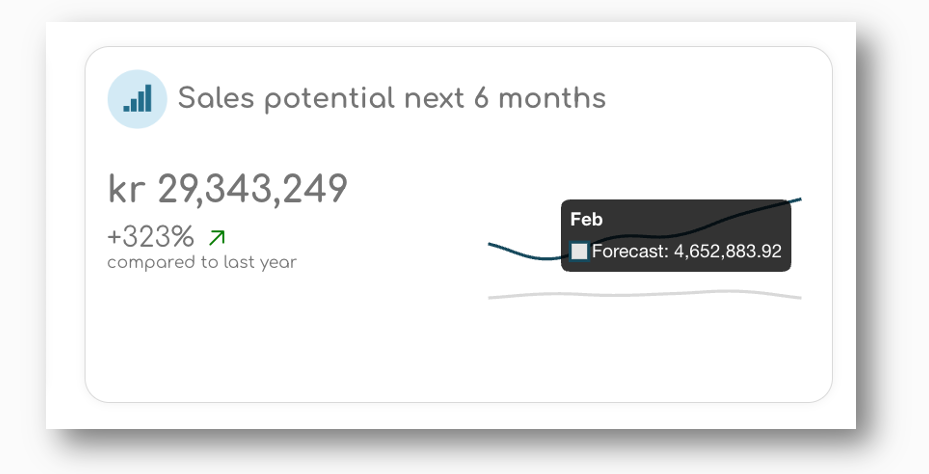
The Sales Potential is based on the sales forecast for all active items in your store, taking into account seasonality and availability. The assumption is that when you reorder in time, stock outs are reduced and you increase sales.
3. Stock Health
The third element shows a stock health analyses, using classic merchandising terms:
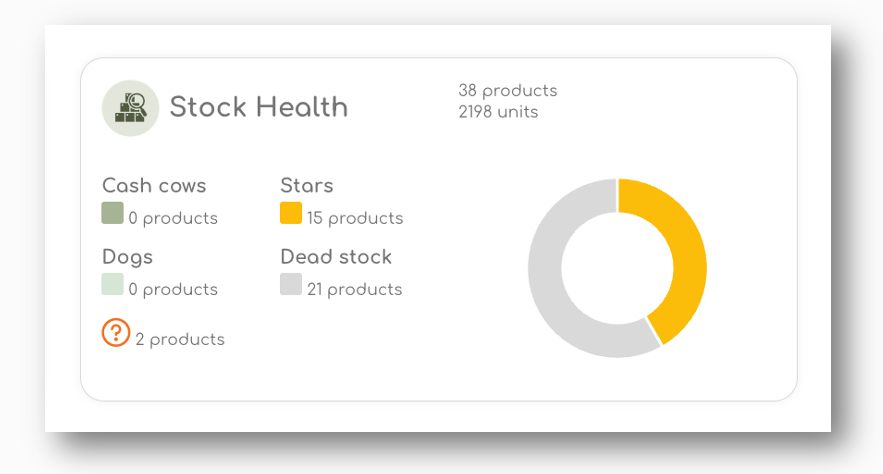
When hovering the 4 different terms, a hover appears explaining the terminology:

Cash Cows
Cash cows are products with a high market share but low market growth.
These products generate steady revenue with little need for investment. They have matured in the market and provide consistent cash flow.
Maintain adequate stock levels and continue to sell these items, as they are reliable sources of profit.
Stars
Stars are high-performing products that have both high sales share and high growth potential.
These products are popular, in-demand, and typically drive significant sales. They often require investment to maintain their growth and share of sales in your store.
Try to invest in promoting and stocking these items, as they have the potential to become your future cash cows.
Dogs
Dogs are products with low sales share and low growth.
These items are typically underperforming, with weak sales and limited future potential. They may be outdated or no longer relevant to your customers.
Consider discontinuing these products or reducing stock levels, as they tie up resources without generating significant returns.
Dead stock
Dead stock refers to products that are unsold or obsolete inventory that has been sitting in your storage for a long time.
These items have not sold for a considerable period and are unlikely to sell without significant markdowns or promotions.
Focus on clearing out dead stock through discounts, bundles, or liquidation sales to free up space and capital for more profitable items.
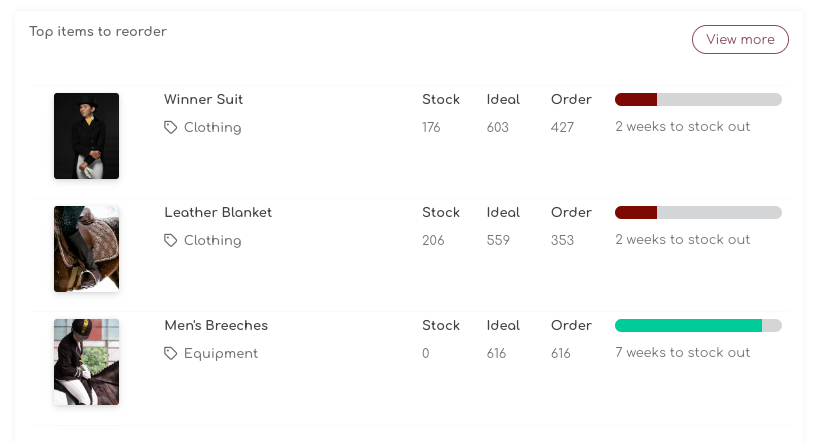
4. Top items to re-order
The first table shows the 10 items that might need immediate attention.
5. Sales Forecast
The graph on the right top of the dashboard shows your store's Sales Forecast compared to last year.
Based on your sales forecast, stock outs and incoming and current stock, we project the sales forecast for the next 26 weeks.
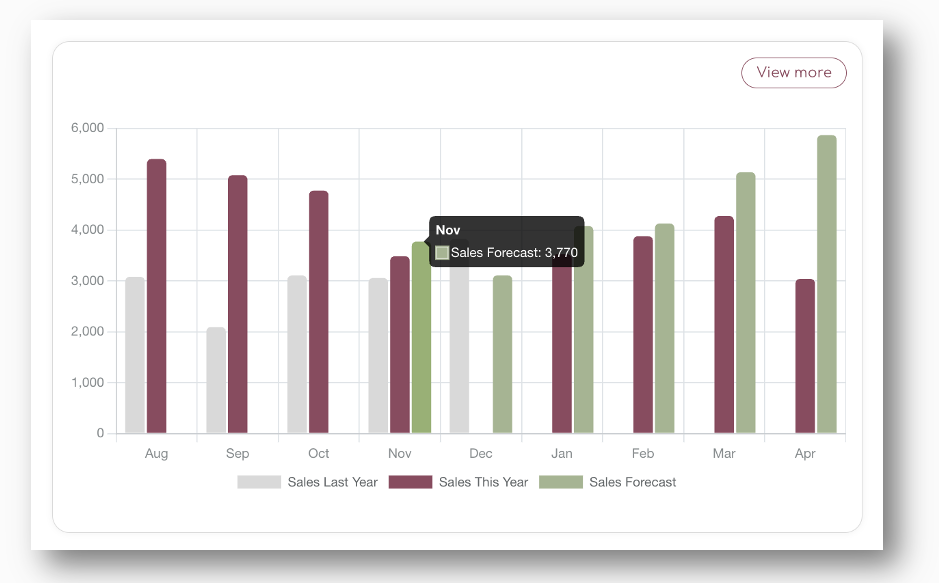
The 'View More' button brings you to the Sales & Stock Projection page, where you can review the same projections on product level.
6. Purchase orders
This is where you find a summary of your placed orders. If orders pass there delivery date, you will receive a notification.
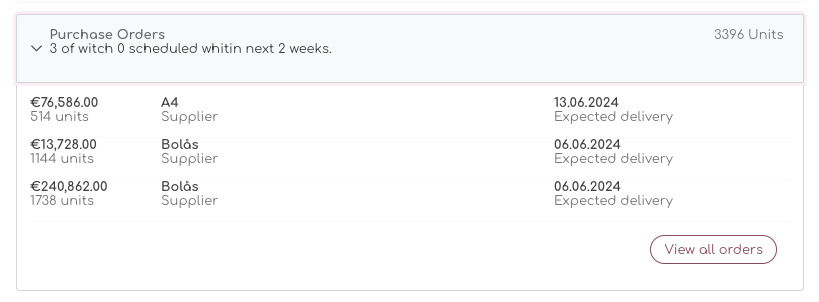
All detailed information (view all orders) can be found under the Order Proposals and the Order History pages.
7. Stock Summary
The Stock Summary report shows the main KPI's of your store at a glance.
If you have set up your suppliers and updated product settings with cost and supplier information, you will find the key measures for your store here.
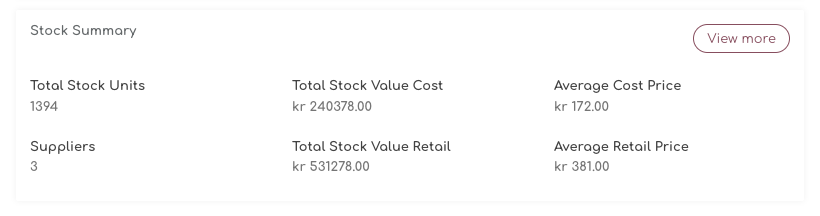
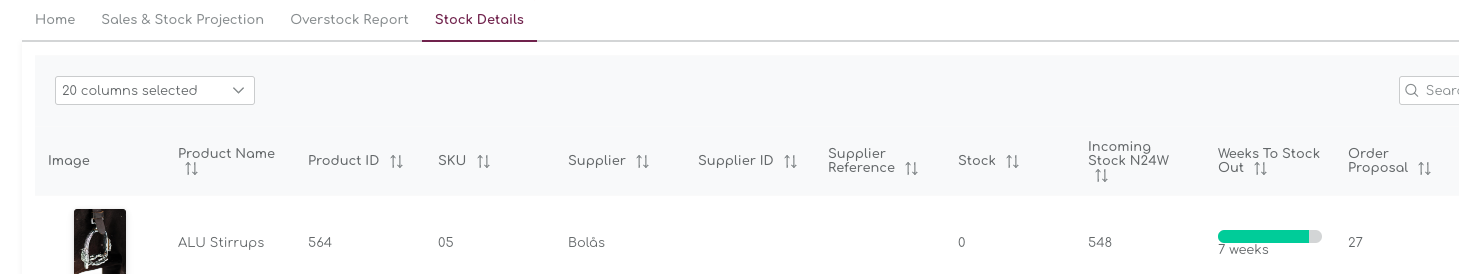
For individual product and category information, you can find the same KPI's on the Stock Detail page:
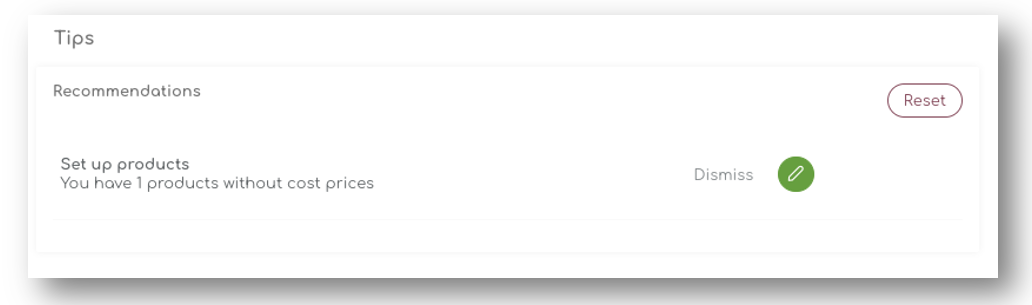
Tips & Recommendations
On the lower left corner of the screen, our Shelf Planner team will provide you with insightful tips and recommendations that will help you to improve your business.
These can be anything from user guides to recommendation the Shelf Planner engine provides. In the example below, the tips are generated when products are missing Cost Prices: