
Stock Health Report

The Stock Health report gives you a quick overview of how your products are performing across your inventory.

It uses a BCG-style portfolio view to group products into Stars, Cash Cows, Dogs, Dead Stock, and Question Marks, helping you understand where your stock is performing well and where products may need further attention.

The report is designed to give you a high-level view first, while allowing you to filter down to specific categories, products, or product grades.

Where can I find Stock Health?

You can find Stock Health in the Reports section of my.shelfplanner.com, alongside Sales & Stock Projection, ABC Analysis, and the Overstock Report.

Using the filters

At the top of the Stock Health report you can filter the results by:

  • Category – view the stock health of a specific product category.
  • Product – search for a particular product.
  • Product Grade – show only products belonging to a specific Stock Health grade.

These filters can be combined to narrow the report down to the products you want to investigate.

For example, you could select a particular category and then filter it to Question Marks to identify products in that category that may require closer attention.


Understanding the Stock Health grades

Stock Health groups products into five different grades.

⭐ Stars

Stars are products showing strong sales performance.

These are products that are contributing significantly to recent sales and are important to keep an eye on from a stock perspective.

The Stock Health summary shows both the number of products classified as Stars and the number of units sold during the last four weeks (L4W).

For example, if the report shows:

4 Stars
28 units sold L4W

this means that four products are currently classified as Stars and, collectively, they sold 28 units during the last four weeks.


💚 Cash Cows

Cash Cows are established products with consistent sales performance.

These products can represent an important and reliable part of your product portfolio. Keeping an appropriate level of stock available helps ensure that continued demand can be met.

The report shows the number of Cash Cow products and their combined units sold during the last four weeks.


🐶 Dogs

Dogs are products with weaker sales performance.

These products may deserve a closer look when reviewing your assortment. Depending on the product, you may want to investigate its sales history, stock level, pricing, seasonality, or whether it still has a role in your assortment.

The Stock Health report helps you identify these products without having to search through your entire catalogue.


⚫ Dead Stock

Dead Stock identifies products that are currently tying up inventory without recent sales activity.

Unlike the other grades, the summary card shows units tied up in stock rather than units sold during the last four weeks.

This makes Dead Stock particularly useful when looking for inventory that may require a clearance strategy, promotion, markdown, or assortment review.

Tip: Dead Stock can be a useful starting point when looking for opportunities to release cash and warehouse or shelf space.


❓ Question Marks

Question Marks are products where the sales picture requires further investigation.

They may be newer products, products with less established sales patterns, or products whose current performance makes their future role less clear.

The report shows the number of Question Mark products together with their recent sales over the last four weeks.

Question Marks are therefore a useful group to investigate before making decisions about replenishment or assortment changes.


The Stock Health overview

The summary cards at the top of the report give you an immediate snapshot of your assortment.

For each grade, you can see:

  • Number of products in that grade
  • Units sold in the last four weeks, where applicable
  • Units tied up in stock for Dead Stock

This lets you quickly identify where most of your recent sales are coming from and whether you have products sitting in stock without recent sales.


Sales & Product Count by Grade

The chart at the bottom of the report provides another way to compare the different grades.

It combines:

  • Product Count – the number of products in each grade
  • Sales L4W (units) – the number of units sold during the last four weeks

This makes it possible to compare the size of each product group with its recent sales activity.

For example, you might have a relatively small number of products generating a large proportion of recent sales, while another group contains many products but contributes relatively few sales.


How should I use the Stock Health report?

Stock Health is primarily an overview and investigation tool.

A useful workflow is:

1. Start with the overview

Look at the five summary cards to understand the current distribution of your products.

2. Look at recent sales

Use the Sales L4W figures and chart to understand which grades are generating recent sales.

3. Investigate Dead Stock

Products classified as Dead Stock can be reviewed for possible clearance, markdowns, promotions, bundles, or removal from the assortment.

4. Investigate Question Marks

Question Marks can be reviewed in more detail to understand whether they are developing products, seasonal products, or products with weaker-than-expected performance.

5. Use the filters

Once you've identified an area you want to investigate, use the Category, Product, and Product Grade filters to narrow the report down.


Stock Health vs. other Shelf Planner reports

Stock Health provides a portfolio-level view of your products. It complements the more detailed reports in Shelf Planner rather than replacing them.

For example:

  • Stock Health → Understand the overall health and classification of your product portfolio.
  • ABC Analysis → Analyse products according to their contribution to sales.
  • Sales & Stock Projection → Look at expected sales and future stock levels.
  • Overstock Report → Identify products where stock levels may be higher than required.
  • Top Items to Replenish → Identify products where replenishment may be required.

Shelf Planner's replenishment calculations also use information such as sales forecasts, current stock, inbound stock, Lead Times and Weeks of Stock when determining replenishment requirements.

Important: Stock Health is intended to help you identify patterns and products to investigate. A product's Stock Health grade should be considered alongside factors such as seasonality, new product launches, promotions, lead times and your wider replenishment strategy.


A small content/UX recommendation

I would not publish the old BCG definitions verbatim in the new article. The current knowledge-base article defines Stars, Cash Cows and Dogs in terms of market share and market growth.

The new screen, however, is clearly an inventory report and displays product counts and recent unit sales. Unless the underlying implementation actually calculates market share/growth, saying that a Star has “high market share and high market growth” could be misleading.

I'd therefore document what Shelf Planner actually measures/displayes, as in the draft above, and add the precise classification rules once those thresholds are finalised. This also leaves the article less exposed to changes in the underlying algorithm.

Whatfix Inc

Enterprise DAP Reviews

See customer outcomes with Whatfix

Ad

More options

Ads do not influence the answers you get from ChatGPT. Your chats stay private. Learn about ads


Today 2:16 PM

A small content/UX recommendation I would not publish the old BCG definitions verbatim in the new article. The current knowledge-base article defines Stars, Cash Cows and Dogs in terms of market share and market growth. support.shelfplanner.com The new screen, however, is clearly an inventory report and displays product counts and recent unit sales. Unless the underlying implementation actually calculates market share/growth, saying that a Star has “high market share and high market growth” could be misleading. I'd therefore document what Shelf Planner actually measures/displayes, as in the draft above, and add the precise classification rules once those thresholds are finalised. This also leaves the article less exposed to changes in the underlying algorithm.

Maybe you can update the text based on this recommendation

Yes. I’d make the article more closely reflect what the new Stock Health report actually shows, and avoid describing the five groups using traditional BCG concepts such as market share/market growth unless those are explicitly part of Shelf Planner’s calculation.

Here’s a cleaner revised version that should be suitable for the knowledge base.


Stock Health

The Stock Health report gives you an overview of the current health of your product portfolio.

Products are grouped into five Stock Health categories:

  • Stars
  • Cash Cows
  • Dogs
  • Dead Stock
  • Question Marks

The report combines these classifications with recent sales and stock information, helping you identify products that may need further investigation.

Where can I find Stock Health?

You can find Stock Health in the Reports section of Shelf Planner.

The report is available alongside other reports such as Sales & Stock Projection, ABC Analysis, and Overstock Report.

Filtering the report

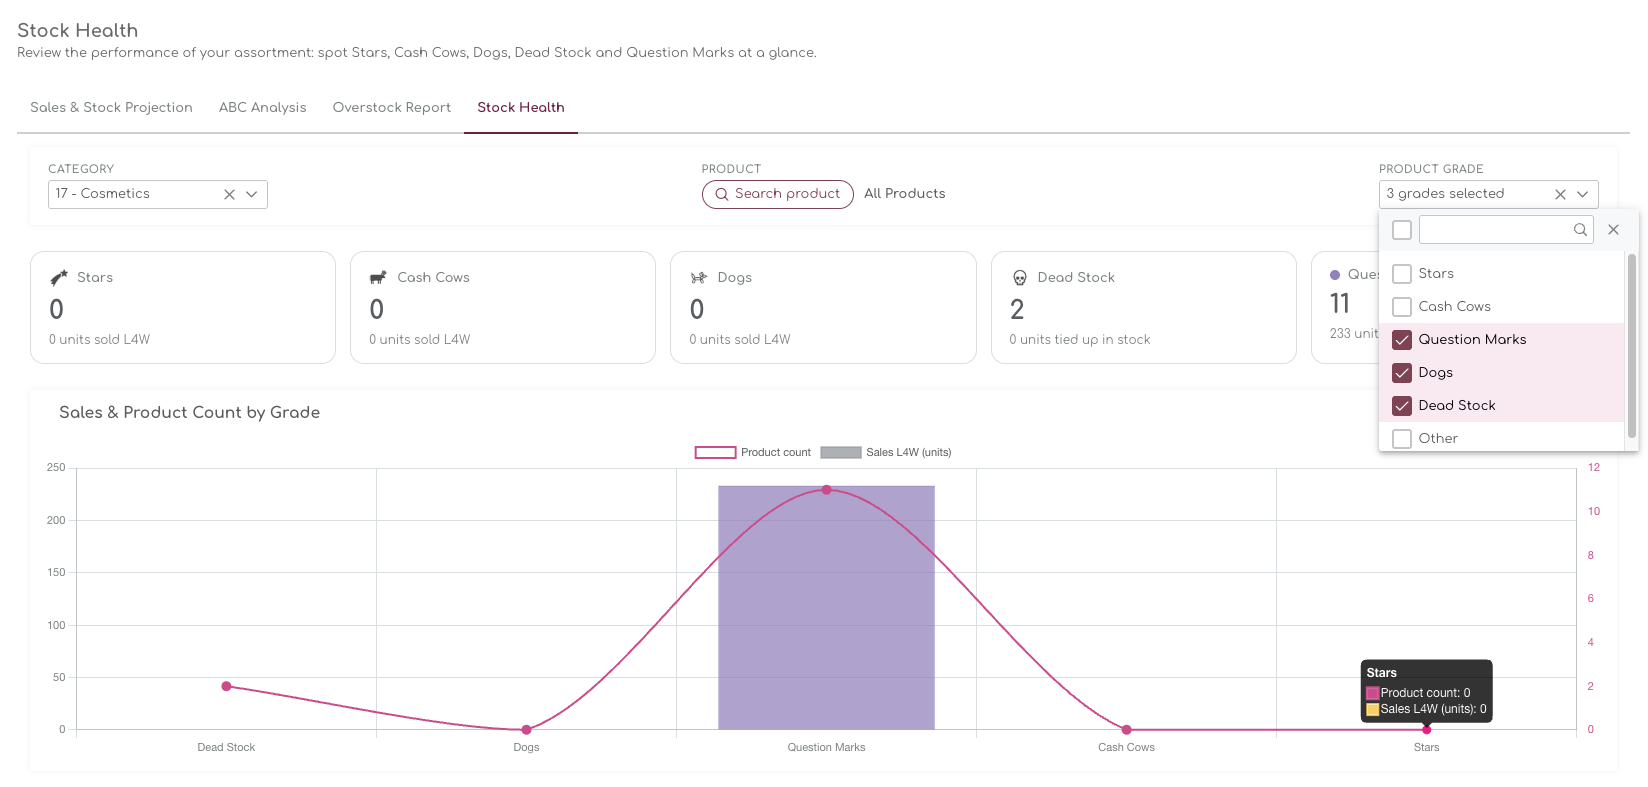
You can narrow down the results using the filters at the top of the report.

Category

Select a specific product category to see the Stock Health information for that category.

Product

Use Search product to find a specific product.

Product Grade

Select a Stock Health grade to see only products assigned to that grade.

You can combine the filters to investigate a specific part of your assortment. For example, you can select a category and then select Dead Stock to focus on products in that category that are currently classified as Dead Stock.
Understanding the Stock Health categories

Stock Health uses five categories to group products according to their current sales and stock situation.

The categories provide a way to identify different types of products within your assortment. They are intended as a starting point for investigating your stock rather than as a recommendation to take a particular action.

Stars

Stars are products that are currently showing strong sales performance.

The Stock Health overview shows how many products are classified as Stars and how many units those products have sold during the last four weeks (L4W).

Use this group to understand which products are currently contributing strongly to recent sales.

Cash Cows

Cash Cows are products with established sales activity.

The report shows the number of products classified as Cash Cows and their units sold during the last four weeks. This can help you identify products with ongoing sales activity within your assortment.

Dogs

Dogs are products with comparatively lower sales activity.

These products can be useful to investigate further when reviewing your assortment, particularly alongside their current stock levels and sales history.

Dead Stock

Dead Stock identifies products that currently have stock but have not generated recent sales according to the Stock Health classification.

For this category, the overview shows the number of products and the units tied up in stock. Dead Stock can therefore help you identify inventory that may warrant further review.

Question Marks

Question Marks are products whose current sales and stock situation places them in this category.

The overview shows the number of Question Mark products and the units they have sold during the last four weeks.

This group can be useful to investigate further, particularly when you want to understand how individual products are performing before making changes to your assortment or replenishment approach.

Stock Health overview

The cards at the top of the report provide a quick summary of your product portfolio.

For each Stock Health category, you can see the number of products currently assigned to that category.

Where applicable, the cards also show:

  • Units sold L4W – units sold during the last four weeks
  • Units tied up in stock – stock currently associated with Dead Stock

This gives you a quick way to see the distribution of your products and their recent sales activity.

Sales & Product Count by Grade

The chart at the bottom of the report provides a visual comparison of the five Stock Health categories.

It displays:

  • Product count – the number of products in each category
  • Sales L4W (units) – units sold during the last four weeks

This allows you to compare the number of products in each category with their recent sales activity.

For example, a category may contain relatively few products but account for a larger number of recent sales. Conversely, a category may contain more products while generating fewer recent sales.

How to use Stock Health

Stock Health is designed to help you identify products and patterns that may need further investigation.

A typical workflow is:

  1. Review the overview
    Start with the five summary cards to see how your products are distributed across the Stock Health categories.
  2. Look at recent sales
    Use the L4W figures and chart to understand recent sales activity across the different categories.
  3. Review Dead Stock
    Investigate products with stock but no recent sales activity.
  4. Explore Question Marks
    Look at individual products in this category to understand their current sales and stock situation.
  5. Use the filters
    Narrow the report to a category, product, or Stock Health grade when you want to investigate a specific group.
  6. Use other Shelf Planner reports for additional context
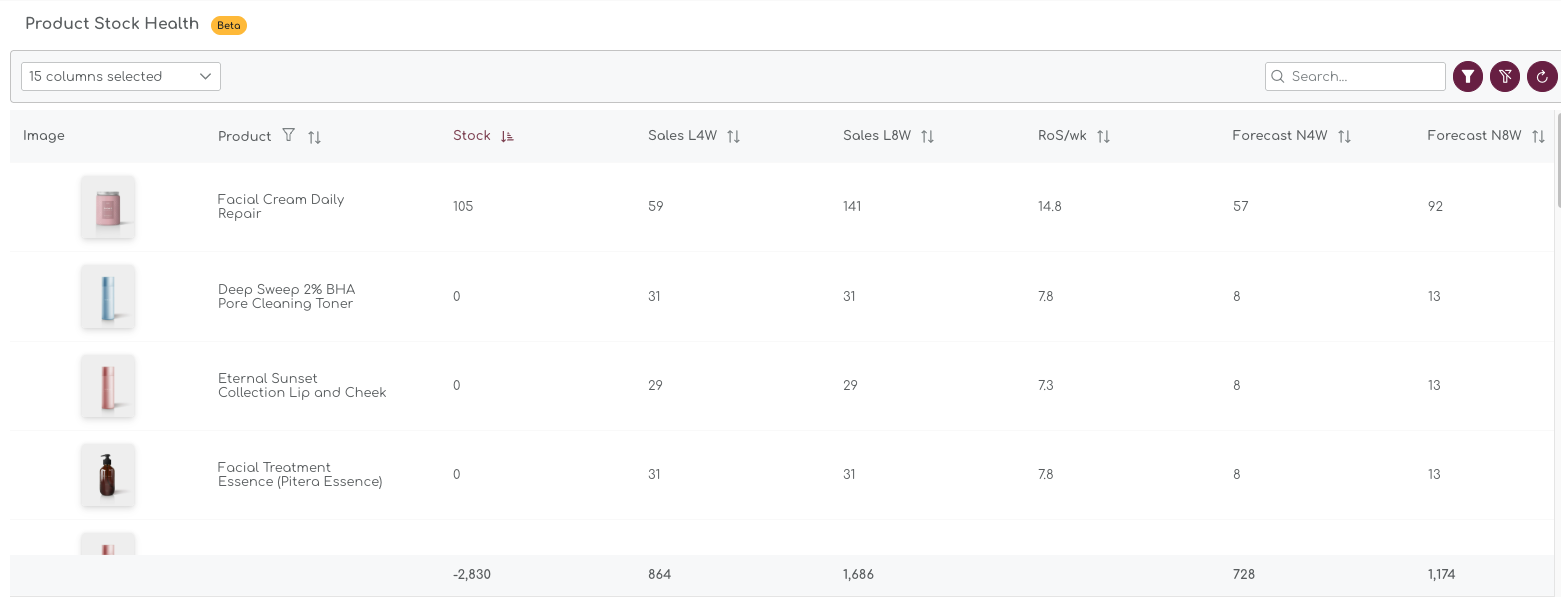
    Stock Health provides an overview. Other reports can give you more detail about sales, projected stock requirements, ABC classification, or overstock.
Stock Health is an overview, not a recommendation

The Stock Health categories are intended to help you spot patterns in your product portfolio.

A product's classification should be considered alongside other relevant information, such as:

  • Recent and historical sales
  • Current stock levels
  • Expected future demand
  • Seasonality
  • Promotions
  • Lead times
  • Your overall assortment strategy

For example, a product with low recent sales may be perfectly healthy if it is seasonal or newly introduced.

Use Stock Health as a starting point for investigation, and use the other Shelf Planner reports to understand the situation in more detail.